Data Intelligence
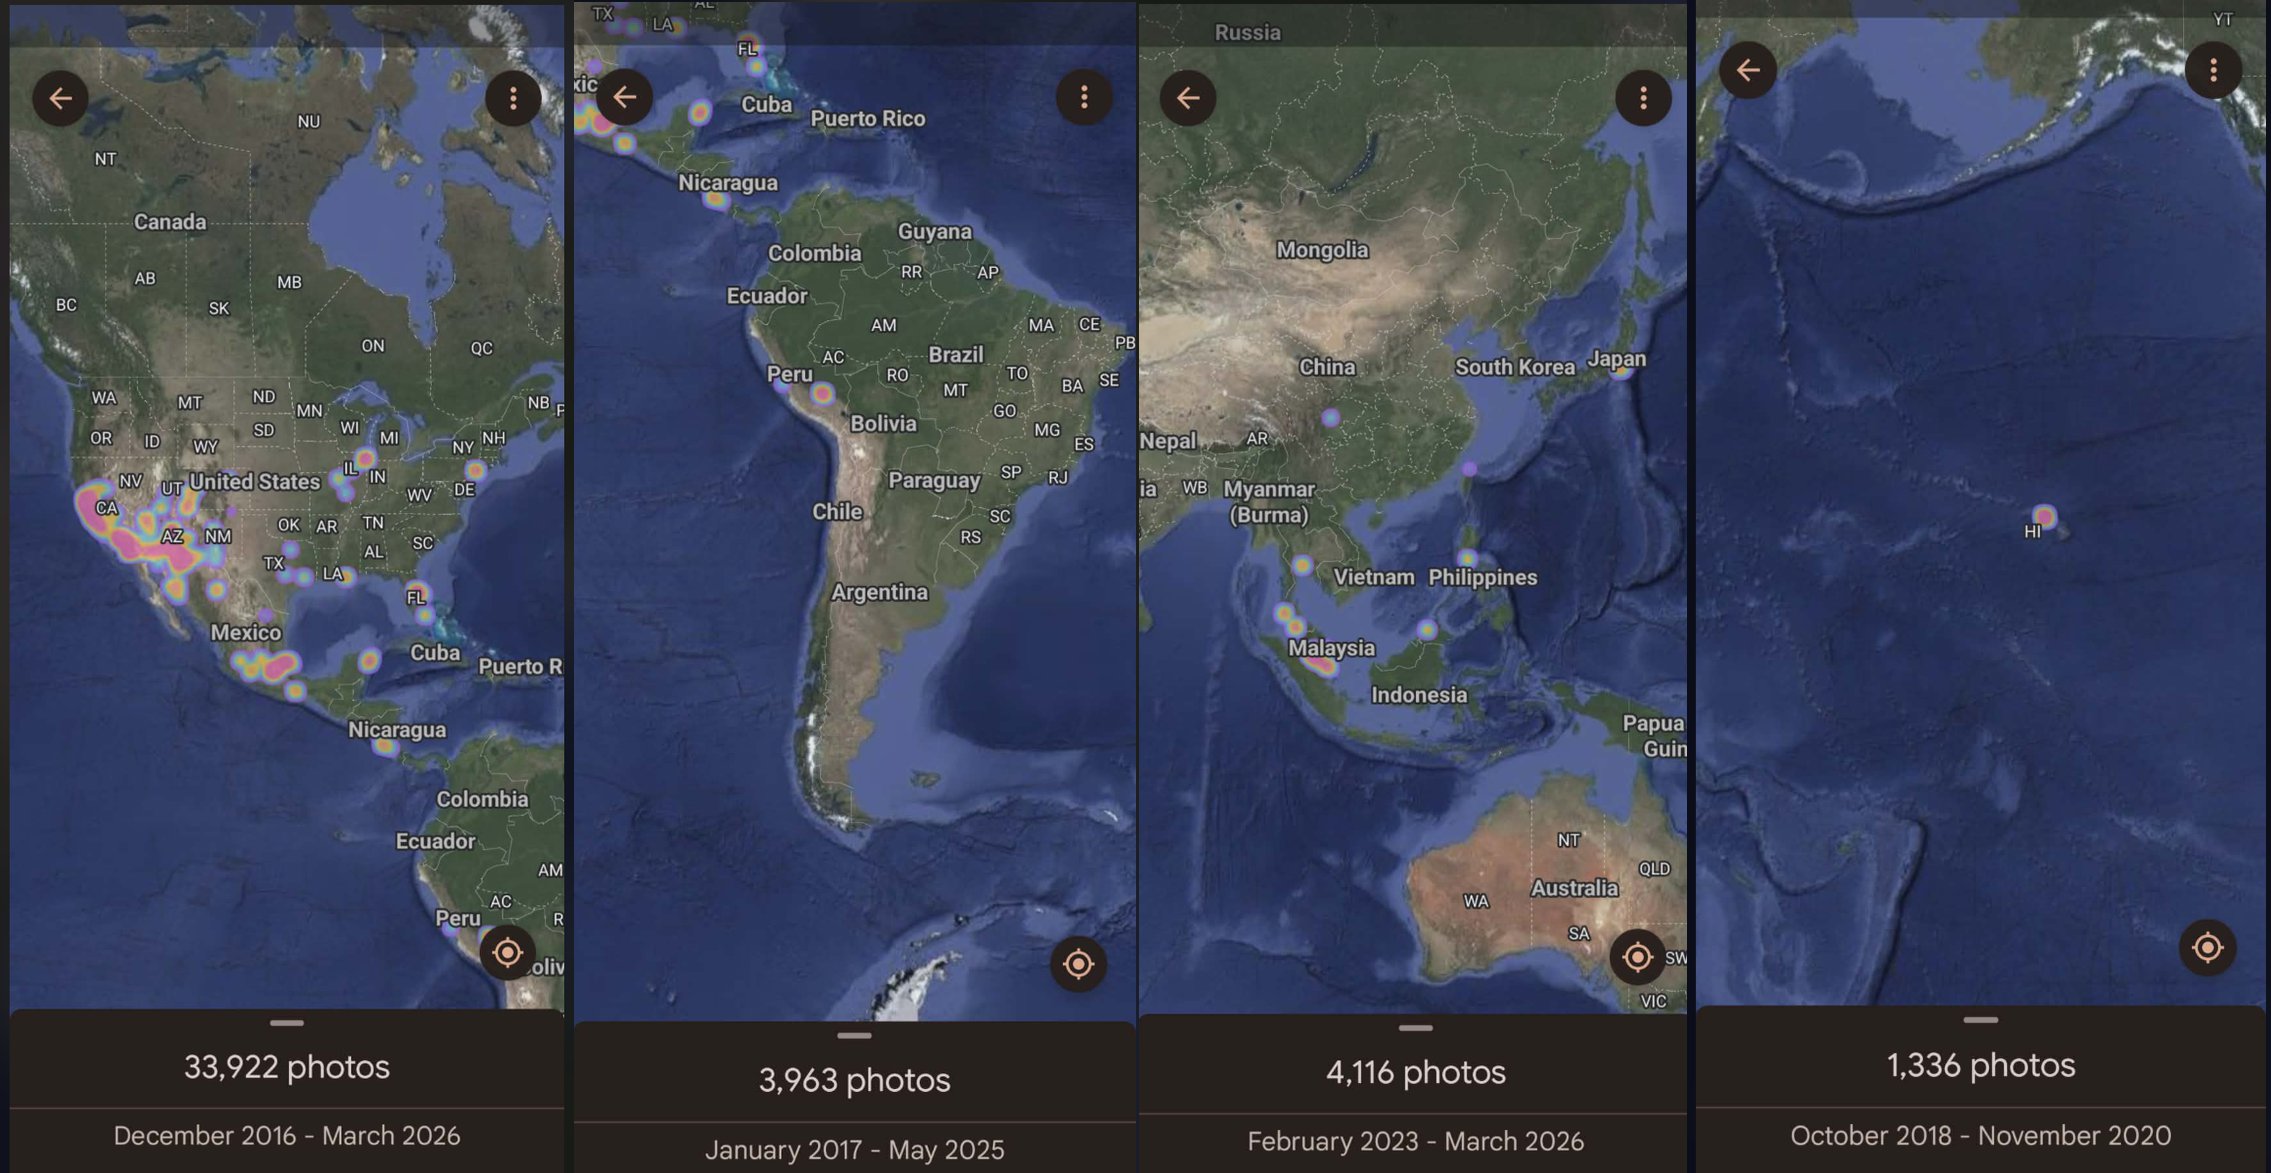
10 years of data.
4 continents of fieldwork.
Everything on the Framework page is an observation. This page is the evidence behind it — the physical data, the patterns, and the metrics that support the research.
What the data shows
Each dot on that map is a location where someone lived, worked, or observed how global service delivery operates on the ground. Not as a tourist. As an employee — checking in guests, resolving tickets, managing teams, and noticing where the system assumed something about the user that was not true.
Reclaiming human time
The core metric is not resolution speed. It is human time reclaimed — minutes returned to people who would otherwise spend them waiting, translating in their head, re-explaining a problem the system should have understood the first time, or navigating an interface that was not designed for the way they think.
Every minute spent on a preventable incident is a minute stolen from a human being. That is what these data points measure — not where someone has traveled, but where that theft has been witnessed, and what patterns emerge when attention is paid to it across a decade.
From observation to prototype
The patterns in this data led to the prototypes on this site. The Touch Screen Interaction came from watching users fail multilingual onboarding. The Mountain came from watching supervisors struggle with administrative tasks that could be translated into something human. Every prototype started as a pattern noticed in the data — a pattern that demanded a response.